03. Accelerometer Deep Dive
heading
Accelerometer Deep-Dive
ND320 C4 L2 03 Accelerometer Deep Dive
recap
Summary
Let’s take a more in-depth look at the accelerometer. As a reminder, when we talk about accelerometer magnitude, this means the vector magnitude of the force on the accelerometer in 3D space, as given by this formula.
acc magnitude

Accelerometer magnitude is the square root of the sum of the squared value of movement in each of the 3 axes.
recap
Take a look at this accelerometer trace when the wearer is at rest.
at rest
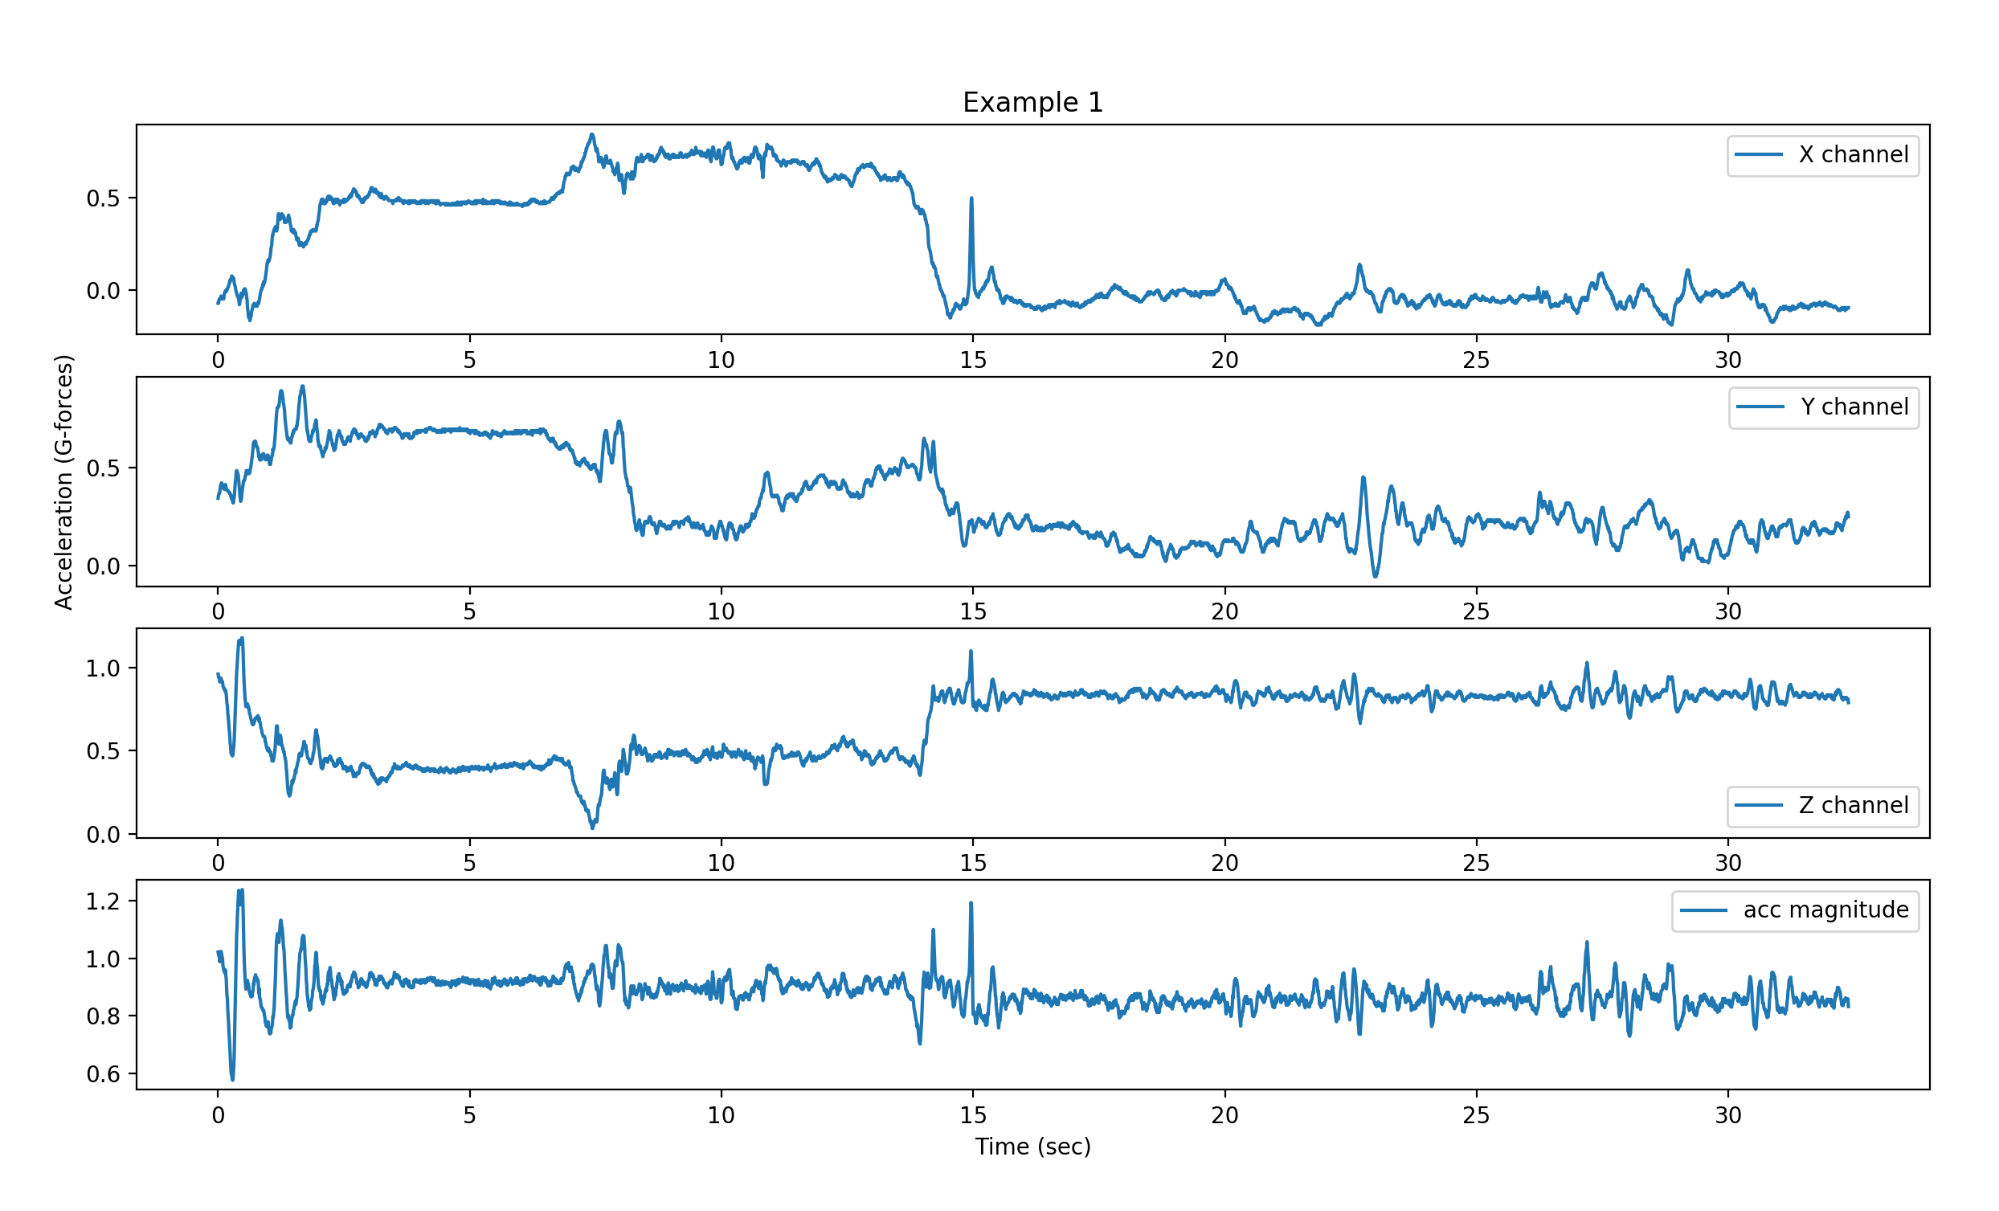
Accelerometer Magnitude - Wearer at Rest
recap - jogger
The accelerometer magnitude is close to 1 g, which means the total force on the accelerometer is only due to gravity. But if you look at the individual channels, they shift around. In the beginning, they all see the same amount of gravitational force, which means the device is tilted along each axis equally. But then after 15 seconds, the x and y channels drop and the z-channel rises to nearly 1g. This indicates the device has moved and is now lying flat, so only the z-channel feels the force of gravity. By strategically placing accelerometers on the body, you can use this technique to figure out things like posture or sleeping position.
jogging
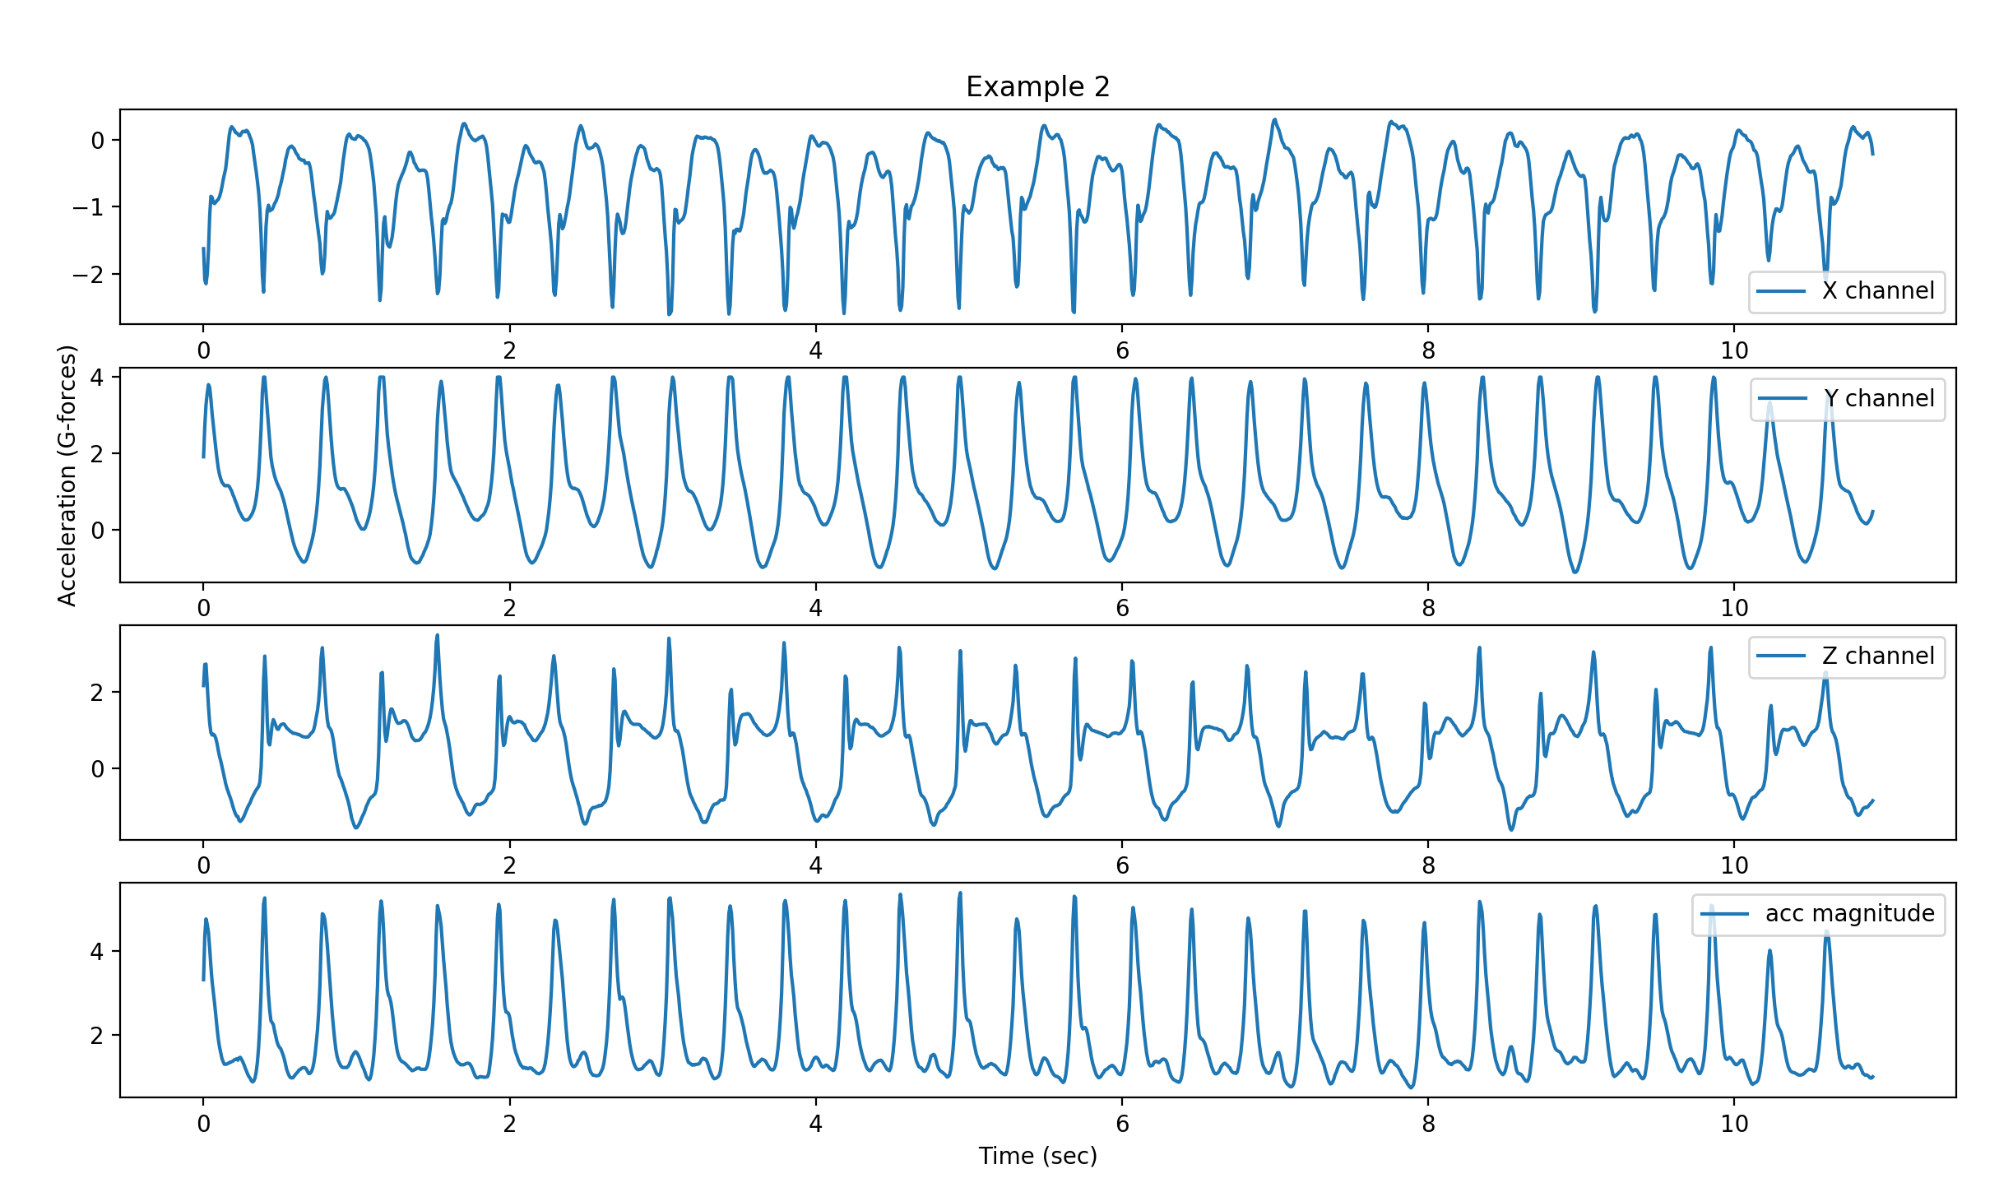
Accelerometer Magnitude - Wearer is Jogging
recap jog
This is a trace of someone who is jogging. Notice the very periodic shapes in each channel that indicate the cadence of the arm swing, which can be used to figure out how fast someone is walking. By analyzing the specific characteristics of the waveform, you can decompose each stride into various components.
For example, this paper decomposes the accelerometer trace from an ankle into various phases of the gait cycle.
gait cycle phase
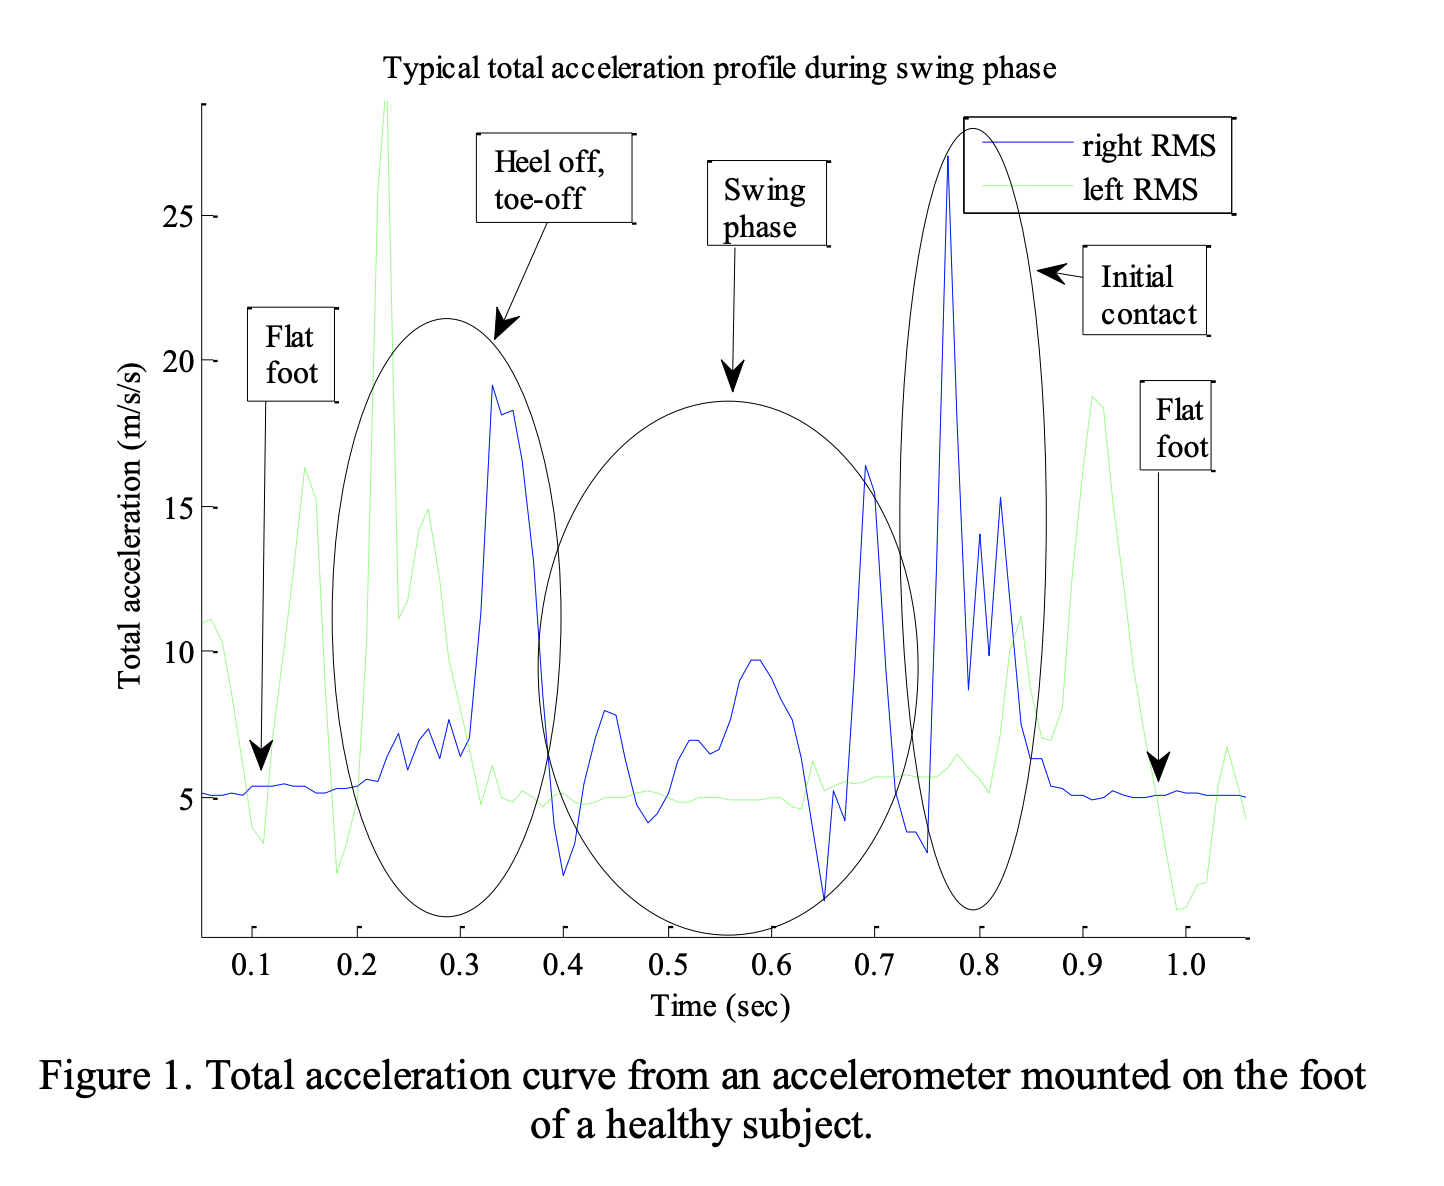
Patterson M., Caulfield B. A novel approach for assessing gait using foot mounted accelerometers; Proceedings of 5th International ICST Conference on Pervasive Computing Technologies for Healthcare; Dublin, Ireland. 23–26 May 2011; pp. 218–221.
recap gait
Discriminating the gait phases like this is an important starting point for several applications such as recovery after an injury or treatment, the classification of daily activities, coaching athletes, and distinguishing between normal and pathological gait. Researchers have found that differences in each person’s gait mean that it can be used to identify individuals.
run with break
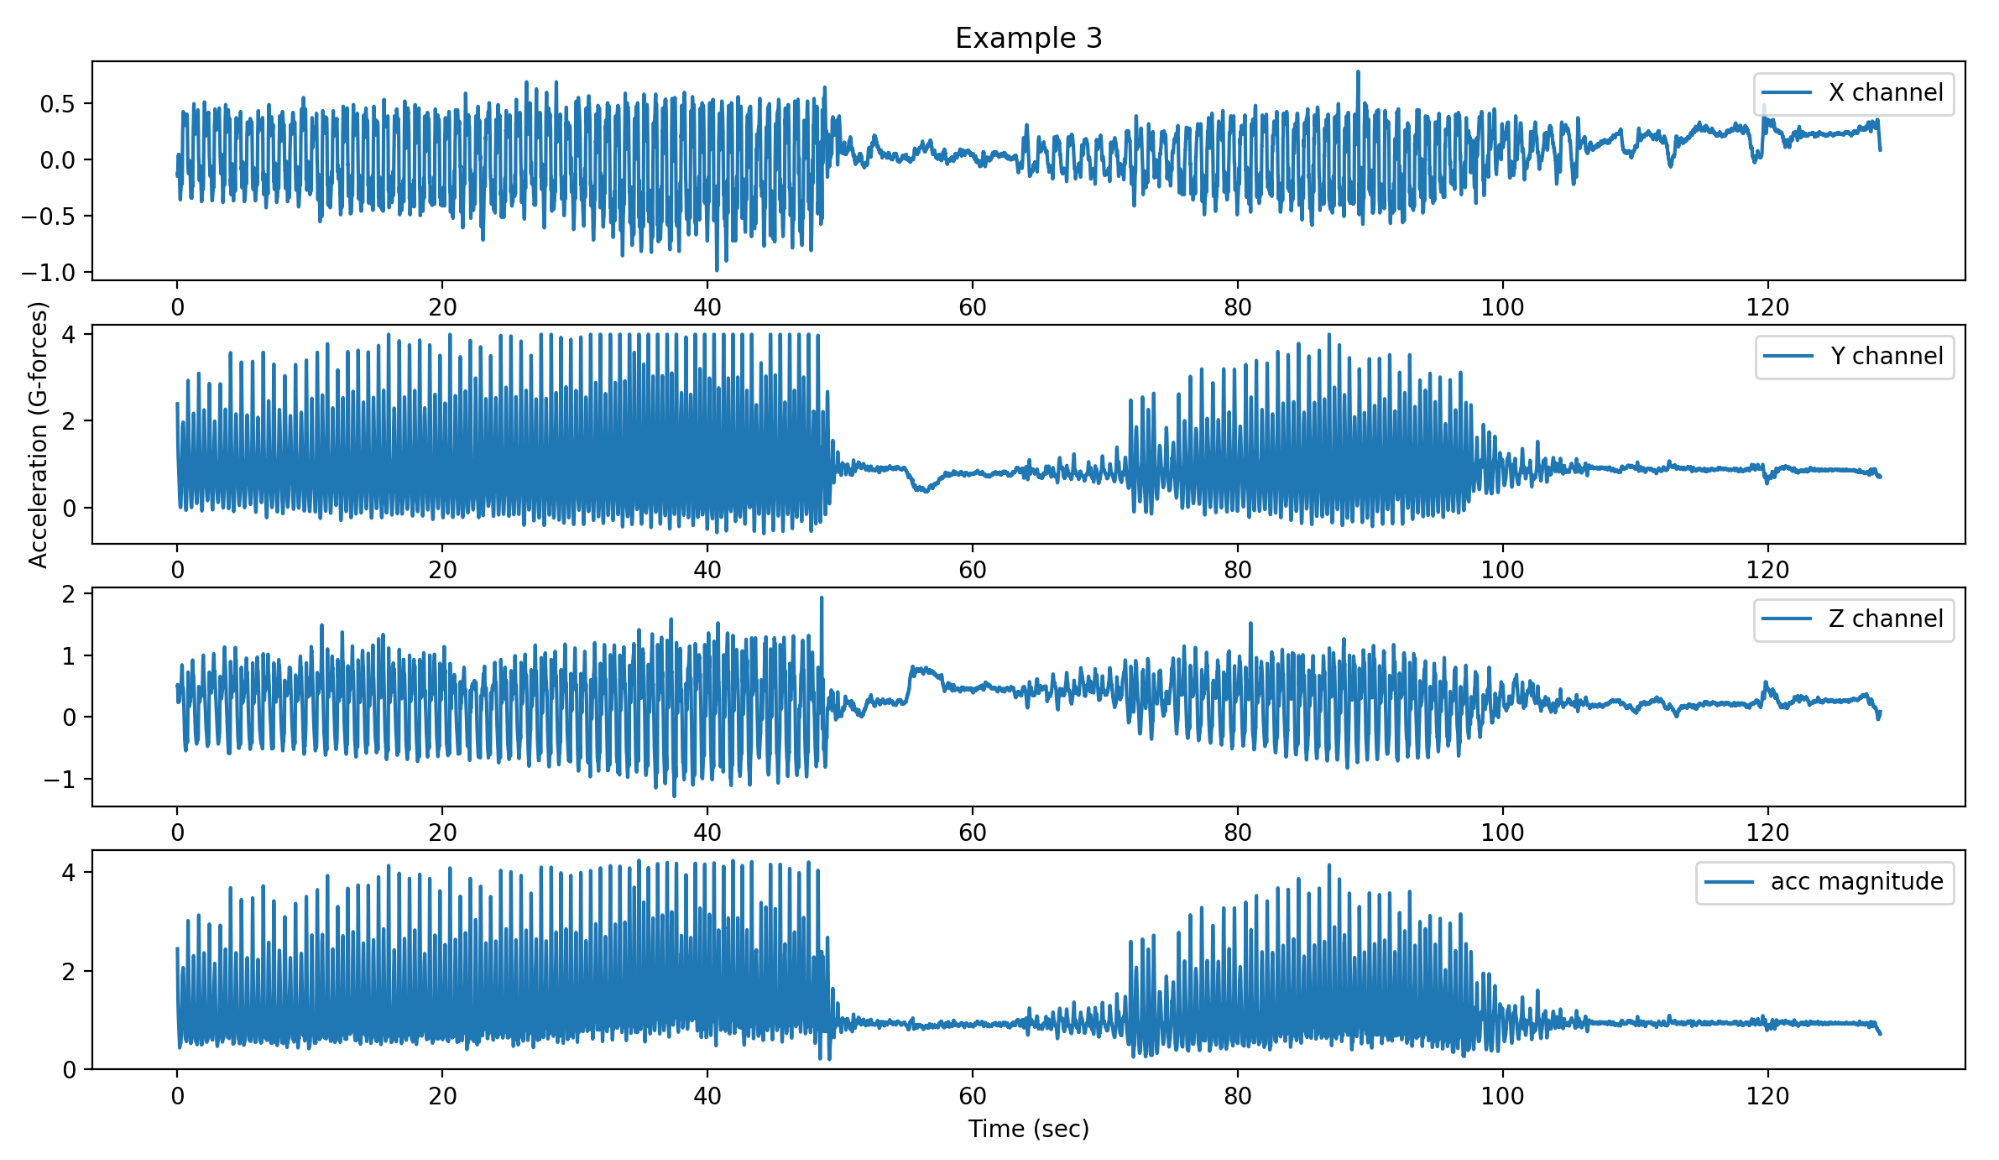
Accelerometer Magnitude - Wearer is running with a break in between
recap magnitude
Here we see a zoomed-out view of the accelerometer trace over 2 minutes. We can see the wearer distinctly changing activities, going from jogging to still to jogging again. You can even tell that they are probably jogging on a treadmill as the speed slowly ramps up and down. And from the sharp cut-off around 50 seconds, maybe we can tell that they jumped off the treadmill or for some reason their treadmill session was cut short. I didn’t collect this dataset, so we can’t know for sure, but it’s interesting that we can learn this level of detail from just an accelerometer alone.
Quiz
Review the set of graphs to answer the following quiz.
Quiz plots
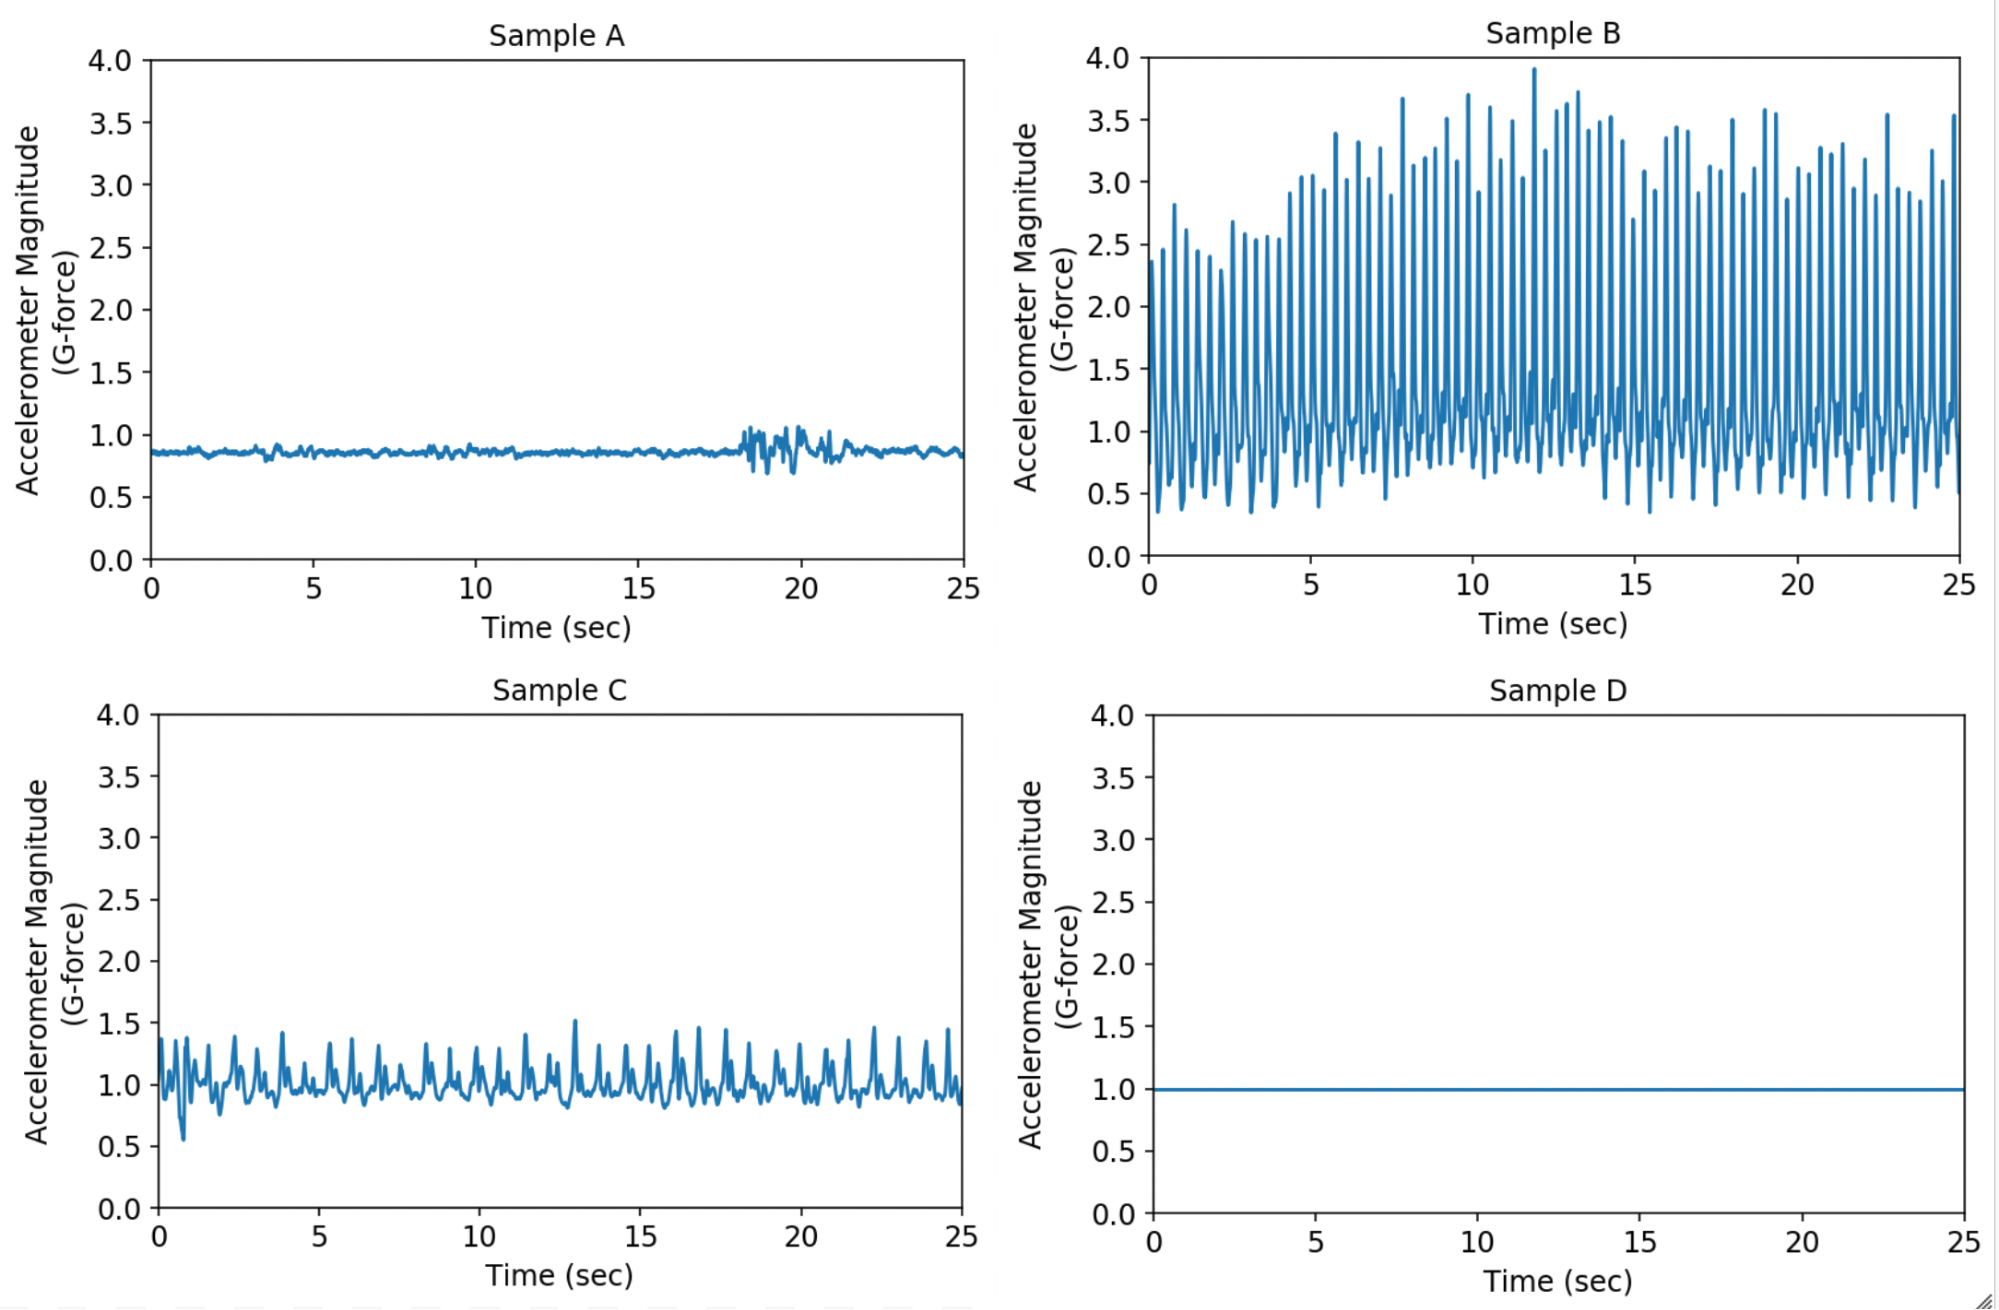
Sample accelerometer traces
QUIZ QUESTION::
Match the accelerometer traces above with the activity being done in each of the above image.
ANSWER CHOICES:
|
Sample Trace |
Activity |
|---|---|
A |
|
B |
|
C |
|
D |
SOLUTION:
|
Sample Trace |
Activity |
|---|---|
|
D |
|
|
B |
|
|
C |
|
|
A |
Exercise Intro
Exercise 1: Step Cadence
Instructions
- Complete the Offline or Online instructions below.
- Read through the whole
.ipynb. - Complete all the code cells that contain
## Your Code Goes Here.
Offline
- In the repo which you can access here in the repo
/intro-to-sensors/exercises/1-step-cadence/you should find the following files:
1_step_cadence.ipynbexercise1.npz
- Open up the python notebook and associated files in your desired editor.
Note: Instructions can be found in Introduction to Wearable Data's Concept Developer Workflow for how to set up your local environment.
Online
- Go to the next concept and the
1_plotting.ipynbshould be open and the workspace should already contain the appropriateexercise1.npzfile.